Mandate!
Sunday, November 9th, 2008I was looking over the current electoral map, and I realized something extraordinary. If Obama took the states where he won by 7 percentage points or more, and McCain took all of the states where Obama won by 6 points or less, Obama would still have won the election 291 – 247. This would put Ohio, Florida, Indiana, and North Carolina in the red, but it would not have changed the outcome. Ohio may have locked in the Obama victory, but it turns out that he didn’t need it.
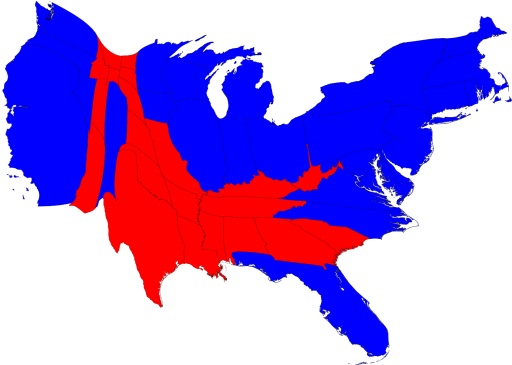
Looking at a traditional electoral map can be deceiving, because the states are shown in proportion to their land area. If instead, you look at a cartogram, you can see how the states compare to each other by, say, population (shown below) and you can really get a sense of how much of the country went red or blue. Professor Mark Newman from the University of Michigan has some good examples on his site:
